
 分类:
分类: 已被围观
已被围观 点击日志分析查询菜单Analytics -> Discover,选择logstash_* 进行日志查询。
Mar
08
2022
SpringCloud—搭建ELK日志采集与分析系统
 编辑搜图
编辑搜图
一套好的日志分析系统可以详细记录系统的运行情况,方便我们定位分析系统性能瓶颈、查找定位系统问题。上一篇说明了日志的多种业务场景以及日志记录的实现方式,那么日志记录下来,相关人员就需要对日志数据进行处理与分析,基于E(ElasticSearch)L(Logstash)K(Kibana)组合的日志分析系统可以说是目前各家公司普遍的首选方案。
-
Elasticsearch: 分布式、RESTful 风格的搜索和数据分析引擎,可快速存储、搜索、分析海量的数据。在ELK中用于存储所有日志数据。
-
Logstash: 开源的数据采集引擎,具有实时管道传输功能。Logstash 能够将来自单独数据源的数据动态集中到一起,对这些数据加以标准化并传输到您所选的地方。在ELK中用于将采集到的日志数据进行处理、转换然后存储到Elasticsearch。
-
Kibana: 免费且开放的用户界面,能够让您对 Elasticsearch 数据进行可视化,并让您在 Elastic Stack 中进行导航。您可以进行各种操作,从跟踪查询负载,到理解请求如何流经您的整个应用,都能轻松完成。在ELK中用于通过界面展示存储在Elasticsearch中的日志数据。
作为微服务集群,必须要考虑当微服务访问量暴增时的高并发场景,此时系统的日志数据同样是爆发式增长,我们需要通过消息队列做流量削峰处理,Logstash官方提供Redis、Kafka、RabbitMQ等输入插件。Redis虽然可以用作消息队列,但其各项功能显示不如单一实现的消息队列,所以通常情况下并不使用它的消息队列功能;Kafka的性能要优于RabbitMQ,通常在日志采集,数据采集时使用较多,所以这里我们采用Kafka实现消息队列功能。
ELK日志分析系统中,数据传输、数据保存、数据展示、流量削峰功能都有了,还少一个组件,就是日志数据的采集,虽然log4j2可以将日志数据发送到Kafka,甚至可以将日志直接输入到Logstash,但是基于系统设计解耦的考虑,业务系统运行不会影响到日志分析系统,同时日志分析系统也不会影响到业务系统,所以,业务只需将日志记录下来,然后由日志分析系统去采集分析即可,Filebeat是ELK日志系统中常用的日志采集器,它是 Elastic Stack 的一部分,因此能够与 Logstash、Elasticsearch 和 Kibana 无缝协作。
-
Kafka: 高吞吐量的分布式发布订阅消息队列,主要应用于大数据的实时处理。
-
Filebeat: 轻量型日志采集器。在 Kubernetes、Docker 或云端部署中部署 Filebeat,即可获得所有的日志流:信息十分完整,包括日志流的 pod、容器、节点、VM、主机以及自动关联时用到的其他元数据。此外,Beats Autodiscover 功能可检测到新容器,并使用恰当的 Filebeat 模块对这些容器进行自适应监测。
软件下载:
因经常遇到在内网搭建环境的问题,所以这里习惯使用下载软件包的方式进行安装,虽没有使用Yum、Docker等安装方便,但是可以对软件目录、配置信息等有更深的了解,在后续采用Yum、Docker等方式安装时,也能清楚安装了哪些东西,安装配置的文件是怎样的,即使出现问题,也可以快速的定位解决。
Elastic Stack全家桶下载主页:
https://www.elastic.co/cn/downloads/。
我们选择如下版本:
-
Elasticsearch8.0.0,下载地址:https://artifacts.elastic.co/downloads/elasticsearch/elasticsearch-8.0.0-linux-x86_64.tar.gz。
-
Logstash8.0.0,下载地址:https://artifacts.elastic.co/downloads/logstash/logstash-8.0.0-linux-x86_64.tar.gz。
-
Kibana8.0.0,下载地址:https://artifacts.elastic.co/downloads/kibana/kibana-8.0.0-linux-x86_64.tar.gz。
-
Filebeat8.0.0,下载地址:https://artifacts.elastic.co/downloads/beats/filebeat/filebeat-8.0.0-linux-x86_64.tar.gz。
Kafka下载:
-
Kafka3.1.0,下载地址:https://dlcdn.apache.org/kafka/3.1.0/kafka_2.13-3.1.0.tgz。
安装配置:
安装前先准备好三台CentOS7服务器用于集群安装,这是IP地址为:172.16.20.220、172.16.20.221、172.16.20.222,然后将上面下载的软件包上传至三台服务器的/usr/local目录。因服务器资源有限,这里所有的软件都安装在这三台集群服务器上,在实际生产环境中,请根据业务需求设计规划进行安装。
在集群搭建时,如果能够编写shell安装脚本就会很方便,如果不能编写,就需要在每台服务器上执行安装命令,多数ssh客户端提供了多会话同时输入的功能,这里一些通用安装命令可以选择启用该功能。
一、安装Elasticsearch集群
1、Elasticsearch是使用Java语言开发的,所以需要在环境上安装jdk并配置环境变量
下载jdk软件包安装,https://www.oracle.com/java/technologies/downloads/#java8。
新建/usr/local/java目录:
复制
mkdir /usr/local/java1.
将下载的jdk软件包jdk-8u64-linux-x64.tar.gz上传到/usr/local/java目录,然后解压。
复制
tar -zxvf jdk-8u77-linux-x64.tar.gz1.
配置环境变量/etc/profile。
复制
vi /etc/profile1.
在底部添加以下内容:
复制
JAVA_HOME=/usr/local/java/jdk1.8.0_64PATH=$JAVA_HOME/bin:$PATHCLASSPATH=$JAVA_HOME/jre/lib/ext:$JAVA_HOME/lib/tools.jarexport PATH JAVA_HOME CLASSPATH1.2.3.4.
使环境变量生效。
复制
source /etc/profile1.
另外一种十分快捷的方式,如果不是内网环境,可以直接使用命令行安装,这里安装的是免费版本的openjdk。
复制
yum install java-1.8.0-openjdk* -y1.
2、安装配置Elasticsearch
进入/usr/local目录,解压Elasticsearch安装包,请确保执行命令前已将环境准备时的Elasticsearch安装包上传至该目录。
复制
tar -zxvf elasticsearch-8.0.0-linux-x86_64.tar.gz1.
重命名文件夹。
复制
mv elasticsearch-8.0.0 elasticsearch1.
elasticsearch不能使用root用户运行,这里创建运行elasticsearch的用户组和用户。
复制
# 创建用户组groupadd elasticsearch# 创建用户并添加至用户组useradd elasticsearch -g elasticsearch# 更改elasticsearch密码,设置一个自己需要的密码,这里设置为和用户名一样:El12345678passwd elasticsearch 1.2.3.4.5.6.
新建elasticsearch数据和日志存放目录,并给elasticsearch用户赋权限。
复制
mkdir -p /data/elasticsearch/datamkdir -p /data/elasticsearch/logchown -R elasticsearch:elasticsearch /data/elasticsearch/*chown -R elasticsearch:elasticsearch /usr/local/elasticsearch/*1.2.3.4.
elasticsearch默认启用了x-pack,集群通信需要进行安全认证,所以这里需要用到SSL证书。注意:这里生成证书的命令只在一台服务器上执行,执行之后copy到另外两台服务器的相同目录下。
复制
# 提示输入密码时,直接回车./elasticsearch-certutil ca -out /usr/local/elasticsearch/config/elastic-stack-ca.p12# 提示输入密码时,直接回车./elasticsearch-certutil cert --ca /usr/local/elasticsearch/config/elastic-stack-ca.p12 -out /usr/local/elasticsearch/config/elastic-certificates.p12 -pass ""# 如果使用root用户生成的证书,记得给elasticsearch用户赋权限chown -R elasticsearch:elasticsearch /usr/local/elasticsearch/config/elastic-certificates.p121.2.3.4.5.6.
设置密码,这里在出现输入密码时,所有的都是输入的123456。
复制
./elasticsearch-setup-passwords interactiveEnter password for [elastic]:
Reenter password for [elastic]:
Enter password for [apm_system]:
Reenter password for [apm_system]:
Enter password for [kibana_system]:
Reenter password for [kibana_system]:
Enter password for [logstash_system]:
Reenter password for [logstash_system]:
Enter password for [beats_system]:
Reenter password for [beats_system]:
Enter password for [remote_monitoring_user]:
Reenter password for [remote_monitoring_user]:
Changed password for user [apm_system]Changed password for user [kibana_system]Changed password for user [kibana]Changed password for user [logstash_system]Changed password for user [beats_system]Changed password for user [remote_monitoring_user]Changed password for user [elastic]1.2.3.4.5.6.7.8.9.10.11.12.13.14.15.16.17.18.19.20.
修改elasticsearch配置文件。
复制
vi /usr/local/elasticsearch/config/elasticsearch.yml1.
复制
# 修改配置# 集群名称cluster.name: log-elasticsearch# 节点名称node.name: node-1# 数据存放路径path.data: /data/elasticsearch/data
 # 日志存放路径path.logs: /data/elasticsearch/log# 当前节点IPnetwork.host: 192.168.60.201
 # 对外端口http.port: 9200# 集群ipdiscovery.seed_hosts: ["172.16.20.220", "172.16.20.221", "172.16.20.222"]# 初始主节点cluster.initial_master_nodes: ["node-1", "node-2", "node-3"]# 新增配置# 集群端口transport.tcp.port: 9300transport.tcp.compress: truehttp.cors.enabled: truehttp.cors.allow-origin: "*" http.cors.allow-methods: OPTIONS, HEAD, GET, POST, PUT, DELETEhttp.cors.allow-headers: "X-Requested-With, Content-Type, Content-Length, X-User"xpack.security.enabled: truexpack.security.transport.ssl.enabled: truexpack.security.transport.ssl.verification_mode: certificatexpack.security.transport.ssl.keystore.path: elastic-certificates.p12xpack.security.transport.ssl.truststore.path: elastic-certificates.p121.2.3.4.5.6.7.8.9.10.11.12.13.14.15.16.17.18.19.20.21.22.23.24.25.26.27.28.29.30.
配置Elasticsearch的JVM参数。
复制
vi /usr/local/elasticsearch/config/jvm.options1.
复制
-Xms1g-Xmx1g1.2.
修改Linux默认资源限制数。
复制
vi /etc/security/limits.conf1.
复制
# 在最后加入,修改完成后,重启系统生效。* soft nofile 131072* hard nofile 1310721.2.3.
复制
vi /etc/sysctl.conf# 将值vm.max_map_count值修改为655360vm.max_map_count=655360# 使配置生效sysctl -p1.2.3.4.5.
切换用户启动服务。
复制
su elasticsearchcd /usr/local/elasticsearch/bin# 控制台启动命令,可以看到具体报错信息./elasticsearch1.2.3.4.
访问我们的服务器地址和端口,可以看到,服务已启动:
http://172.16.20.220:9200/http://172.16.20.221:9200/http://172.16.20.222:9200/。
正常运行没有问题后,Ctrl+c关闭服务,然后使用后台启动命令。
复制
./elasticsearch -d1.
备注:后续可通过此命令停止elasticsearch运行。
复制
# 查看进程idps -ef | grep elastic# 关闭进程kill -9 1376(进程id)1.2.3.4.
3、安装ElasticSearch界面管理插件elasticsearch-head,只需要在一台服务器上安装即可,这里我们安装到172.16.20.220服务器上
配置nodejs环境:
下载地址: (https://nodejs.org/dist/v16.14.0/node-v16.14.0-linux-x64.tar.xz)[https://nodejs.org/dist/v16.14.0/node-v16.14.0-linux-x64.tar.xz],将node-v16.14.0-linux-x64.tar.xz上传到服务器172.16.20.220的/usr/local目录。
复制
# 解压tar -xvJf node-v16.14.0-linux-x64.tar.xz# 重命名mv node-v16.14.0-linux-x64 nodejs# 配置环境变量vi /etc/profile# 新增以下内容export NODE_HOME=/usr/local/nodejsPATH=$JAVA_HOME/bin:$NODE_HOME/bin:/usr/local/mysql/bin:/usr/local/subversion/bin:$PATHexport PATH JAVA_HOME NODE_HOME JENKINS_HOME CLASSPATH# 使配置生效source /etc/profile# 测试是否配置成功node -v1.2.3.4.5.6.7.8.9.10.11.12.13.14.
配置elasticsearch-head:
项目开源地址:https://github.com/mobz/elasticsearch-headzip包下载地址:https://github.com/mobz/elasticsearch-head/archive/master.zip下载后上传至172.16.20.220的/usr/local目录,然后进行解压安装。
复制
# 解压unzip elasticsearch-head-master.zip# 重命名mv elasticsearch-head-master elasticsearch-head# 进入到elasticsearch-head目录cd elasticsearch-head#切换软件源,可以提升安装速度npm config set registry https://registry.npm.taobao.org# 执行安装命令npm install -g npm@8.5.1npm install phantomjs-prebuilt@2.1.16 --ignore-scriptsnpm install# 启动命令npm run start1.2.3.4.5.6.7.8.9.10.11.12.13.14.
浏览器访问http://172.16.20.220:9100/?auth_user=elastic&auth_password=123456 ,需要加上我们上面设置的用户名密码,就可以看到我们的Elasticsearch集群状态了。
二、安装Kafka集群
环境准备:
新建kafka的日志目录和zookeeper数据目录,因为这两项默认放在tmp目录,而tmp目录中内容会随重启而丢失,所以我们自定义以下目录:
复制
 mkdir /data/zookeeper
 mkdir /data/zookeeper/data
 mkdir /data/zookeeper/logs
 mkdir /data/kafka
 mkdir /data/kafka/data
 mkdir /data/kafka/logs1.2.3.4.5.6.
zookeeper.properties配置:
复制
vi /usr/local/kafka/config/zookeeper.properties1.
修改如下:
复制
# 修改为自定义的zookeeper数据目录dataDir=/data/zookeeper/data# 修改为自定义的zookeeper日志目录dataLogDir=/data/zookeeper/logs# 端口clientPort=2181# 注释掉#maxClientCnxns=0# 设置连接参数,添加如下配置# 为zk的基本时间单元,毫秒tickTime=2000# Leader-Follower初始通信时限 tickTime*10initLimit=10# Leader-Follower同步通信时限 tickTime*5syncLimit=5# 设置broker Id的服务地址,本机ip一定要用0.0.0.0代替server.1=0.0.0.0:2888:3888server.2=172.16.20.221:2888:3888server.3=172.16.20.222:2888:38881.2.3.4.5.6.7.8.9.10.11.12.13.14.15.16.17.18.19.
在各台服务器的zookeeper数据目录/data/zookeeper/data添加myid文件,写入服务broker.id属性值。
在data文件夹中新建myid文件,myid文件的内容为1(一句话创建:echo 1 > myid)。
复制
cd /data/zookeeper/datavi myid#添加内容:1 其他两台主机分别配置 2和311.2.3.4.
kafka配置,进入config目录下,修改server.properties文件。
复制
vi /usr/local/kafka/config/server.properties1.
复制
# 每台服务器的broker.id都不能相同broker.id=1# 是否可以删除topicdelete.topic.enable=true# topic 在当前broker上的分片个数,与broker保持一致num.partitions=3# 每个主机地址不一样:listeners=PLAINTEXT://172.16.20.220:9092advertised.listeners=PLAINTEXT://172.16.20.220:9092# 具体一些参数log.dirs=/data/kafka/kafka-logs# 设置zookeeper集群地址与端口如下:zookeeper.connect=172.16.20.220:2181,172.16.20.221:2181,172.16.20.222:21811.2.3.4.5.6.7.8.9.10.11.12.13.
Kafka启动:
kafka启动时先启动zookeeper,再启动kafka;关闭时相反,先关闭kafka,再关闭zookeeper。
1、zookeeper启动命令
复制
./zookeeper-server-start.sh ../config/zookeeper.properties &1.
后台运行启动命令:
复制
nohup ./zookeeper-server-start.sh ../config/zookeeper.properties >/data/zookeeper/logs/zookeeper.log 2>1 &1.
或者:
复制
./zookeeper-server-start.sh -daemon ../config/zookeeper.properties &1.
查看集群状态:
复制
./zookeeper-server-start.sh status ../config/zookeeper.properties1.
2、kafka启动命令
复制
./kafka-server-start.sh ../config/server.properties &1.
后台运行启动命令:
复制
nohup bin/kafka-server-start.sh ../config/server.properties >/data/kafka/logs/kafka.log 2>1 &1.
或者:
复制
./kafka-server-start.sh -daemon ../config/server.properties &1.
3、创建topic,最新版本已经不需要使用zookeeper参数创建
复制
./kafka-topics.sh --create --replication-factor 2 --partitions 1 --topic test --bootstrap-server 172.16.20.220:90921.
参数解释:
复制两份--replication-factor 2。
创建1个分区--partitions 1。
topic 名称--topic test。
4、查看已经存在的topic(三台设备都执行时可以看到)
复制
./kafka-topics.sh --list --bootstrap-server 172.16.20.220:90921.
5、启动生产者:
复制
./kafka-console-producer.sh --broker-list 172.16.20.220:9092 --topic test1.
6、启动消费者:
复制
./kafka-console-consumer.sh --bootstrap-server 172.16.20.221:9092 --topic test./kafka-console-consumer.sh --bootstrap-server 172.16.20.222:9092 --topic test1.2.
添加参数 --from-beginning 从开始位置消费,不是从最新消息。
复制
./kafka-console-consumer.sh --bootstrap-server 172.16.20.221 --topic test --from-beginning1.
7、测试:在生产者输入test,可以在消费者的两台服务器上看到同样的字符test,说明Kafka服务器集群已搭建成功
三、安装配置Logstash
Logstash没有提供集群安装方式,相互之间并没有交互,但是我们可以配置同属一个Kafka消费者组,来实现统一消息只消费一次的功能。
解压安装包:
复制
tar -zxvf logstash-8.0.0-linux-x86_64.tar.gzmv logstash-8.0.0 logstash1.2.
配置kafka主题和组。
复制
cd logstash# 新建配置文件vi logstash-kafka.conf# 新增以下内容input {  kafka {    codec => "json"
    group_id => "logstash"
    client_id => "logstash-api"
    topics_pattern => "api_log"
    type => "api"
    bootstrap_servers => "172.16.20.220:9092,172.16.20.221:9092,172.16.20.222:9092"
    auto_offset_reset => "latest"
  }  kafka {    codec => "json"
    group_id => "logstash"
    client_id => "logstash-operation"
    topics_pattern => "operation_log"
    type => "operation"
    bootstrap_servers => "172.16.20.220:9092,172.16.20.221:9092,172.16.20.222:9092"
    auto_offset_reset => "latest"
  }  kafka {    codec => "json"
    group_id => "logstash"
    client_id => "logstash-debugger"
    topics_pattern => "debugger_log"
    type => "debugger"
    bootstrap_servers => "172.16.20.220:9092,172.16.20.221:9092,172.16.20.222:9092"
    auto_offset_reset => "latest"
  }  kafka {    codec => "json"
    group_id => "logstash"
    client_id => "logstash-nginx"
    topics_pattern => "nginx_log"
    type => "nginx"
    bootstrap_servers => "172.16.20.220:9092,172.16.20.221:9092,172.16.20.222:9092"
    auto_offset_reset => "latest"
  }
}output { if [type] == "api"{  elasticsearch {    hosts => ["172.16.20.220:9200","172.16.20.221:9200","172.16.20.222:9200"]    index => "logstash_api-%{+YYYY.MM.dd}"
    user => "elastic"
    password => "123456"
  }
 } if [type] == "operation"{  elasticsearch {    hosts => ["172.16.20.220:9200","172.16.20.221:9200","172.16.20.222:9200"]    index => "logstash_operation-%{+YYYY.MM.dd}"
    user => "elastic"
    password => "123456"
  }
 } if [type] == "debugger"{  elasticsearch {    hosts => ["172.16.20.220:9200","172.16.20.221:9200","172.16.20.222:9200"]    index => "logstash_operation-%{+YYYY.MM.dd}"
    user => "elastic"
    password => "123456"
  }
 } if [type] == "nginx"{  elasticsearch {    hosts => ["172.16.20.220:9200","172.16.20.221:9200","172.16.20.222:9200"]    index => "logstash_operation-%{+YYYY.MM.dd}"
    user => "elastic"
    password => "123456"
  }
 }
}1.2.3.4.5.6.7.8.9.10.11.12.13.14.15.16.17.18.19.20.21.22.23.24.25.26.27.28.29.30.31.32.33.34.35.36.37.38.39.40.41.42.43.44.45.46.47.48.49.50.51.52.53.54.55.56.57.58.59.60.61.62.63.64.65.66.67.68.69.70.71.72.73.74.75.76.
启动logstash:
复制
# 切换到bin目录cd /usr/local/logstash/bin# 启动命令nohup ./logstash -f ../config/logstash-kafka.conf &#查看启动日志tail -f nohup.out1.2.3.4.5.6.
四、安装配置Kibana
解压安装文件:
复制
tar -zxvf kibana-8.0.0-linux-x86_64.tar.gzmv kibana-8.0.0 kibana1.2.
修改配置文件:
复制
cd /usr/local/kibana/configvi kibana.yml# 修改以下内容server.port: 5601server.host: "172.16.20.220"elasticsearch.hosts: ["http://172.16.20.220:9200","http://172.16.20.221:9200","http://172.16.20.222:9200"]elasticsearch.username: "kibana_system"elasticsearch.password: "123456"1.2.3.4.5.6.7.8.
启动服务:
复制
cd /usr/local/kibana/bin# 默认不允许使用root运行,可以添加 --allow-root 参数使用root用户运行,也可以跟Elasticsearch一样新增一个用户组用户nohup ./kibana --allow-root &1.2.3.
访问http://172.16.20.220:5601/,并使用elastic / 123456登录。
五、安装Filebeat
Filebeat用于安装在业务软件运行服务器,收集业务产生的日志,并推送到我们配置的Kafka、Redis、RabbitMQ等消息中间件,或者直接保存到Elasticsearch,下面来讲解如何安装配置:
1、进入到/usr/local目录,执行解压命令
复制
tar -zxvf filebeat-8.0.0-linux-x86_64.tar.gzmv filebeat-8.0.0-linux-x86_64 filebeat1.2.
2、编辑配置filebeat.yml
配置文件中默认是输出到elasticsearch,这里我们改为kafka,同文件目录下的filebeat.reference.yml文件是所有配置的实例,可以直接将kafka的配置复制到filebeat.yml。
配置采集开关和采集路径:
复制
# filestream is an input for collecting log messages from files.- type: filestream
  # Change to true to enable this input configuration.  # enable改为true
  enabled: true
  # Paths that should be crawled and fetched. Glob based paths.  # 修改微服务日志的实际路径
  paths:    - /data/gitegg/log/gitegg-service-system/*.log
    - /data/gitegg/log/gitegg-service-base/*.log
    - /data/gitegg/log/gitegg-service-oauth/*.log
    - /data/gitegg/log/gitegg-service-gateway/*.log
    - /data/gitegg/log/gitegg-service-extension/*.log
    - /data/gitegg/log/gitegg-service-bigdata/*.log
    #- c:\programdata\elasticsearch\logs\*
  # Exclude lines. A list of regular expressions to match. It drops the lines that are
  # matching any regular expression from the list.
  #exclude_lines: ['^DBG']
  # Include lines. A list of regular expressions to match. It exports the lines that are
  # matching any regular expression from the list.
  #include_lines: ['^ERR', '^WARN']
  # Exclude files. A list of regular expressions to match. Filebeat drops the files that
  # are matching any regular expression from the list. By default, no files are dropped.
  #prospector.scanner.exclude_files: ['.gz$']
  # Optional additional fields. These fields can be freely picked
  # to add additional information to the crawled log files for filtering
  #fields:
  #  level: debug
  #  review: 11.2.3.4.5.6.7.8.9.10.11.12.13.14.15.16.17.18.19.20.21.22.23.24.25.26.27.28.29.
Elasticsearch 模板配置 :
复制
# ======================= Elasticsearch template setting =======================setup.template.settings:  index.number_of_shards: 3
  index.number_of_replicas: 1
  #index.codec: best_compression
  #_source.enabled: false# 允许自动生成index模板setup.template.enabled: true# # 生成index模板时字段配置文件setup.template.fields: fields.yml# # 如果存在模块则覆盖setup.template.overwrite: true# # 生成index模板的名称setup.template.name: "api_log" # # 生成index模板匹配的index格式 setup.template.pattern: "api-*" #索引生命周期管理ilm功能默认开启,开启的情况下索引名称只能为filebeat-*, 通过setup.ilm.enabled: false进行关闭;setup.ilm.pattern: "{now/d}"setup.ilm.enabled: false1.2.3.4.5.6.7.8.9.10.11.12.13.14.15.16.17.18.19.
开启仪表盘并配置使用Kibana仪表盘:
复制
# ================================= Dashboards =================================# These settings control loading the sample dashboards to the Kibana index. Loading# the dashboards is disabled by default and can be enabled either by setting the# options here or by using the `setup` command.setup.dashboards.enabled: true# The URL from where to download the dashboards archive. By default this URL# has a value which is computed based on the Beat name and version. For released# versions, this URL points to the dashboard archive on the artifacts.elastic.co# website.#setup.dashboards.url:# =================================== Kibana ===================================# Starting with Beats version 6.0.0, the dashboards are loaded via the Kibana API.# This requires a Kibana endpoint configuration.setup.kibana:  # Kibana Host
  # Scheme and port can be left out and will be set to the default (http and 5601)  # In case you specify and additional path, the scheme is required: http://localhost:5601/path
  # IPv6 addresses should always be defined as: https://[2001:db8::1]:5601
  host: "172.16.20.220:5601"
  # Kibana Space ID
  # ID of the Kibana Space into which the dashboards should be loaded. By default,  # the Default Space will be used.  #space.id:1.2.3.4.5.6.7.8.9.10.11.12.13.14.15.16.17.18.19.20.21.22.23.
配置输出到Kafka,完整的filebeat.yml如下:
复制
###################### Filebeat Configuration Example ########################## This file is an example configuration file highlighting only the most common# options. The filebeat.reference.yml file from the same directory contains all the# supported options with more comments. You can use it as a reference.## You can find the full configuration reference here:# https://www.elastic.co/guide/en/beats/filebeat/index.html# For more available modules and options, please see the filebeat.reference.yml sample# configuration file.# ============================== Filebeat inputs ===============================filebeat.inputs:# Each - is an input. Most options can be set at the input level, so# you can use different inputs for various configurations.# Below are the input specific configurations.# filestream is an input for collecting log messages from files.- type: filestream
  # Change to true to enable this input configuration.  enabled: true
  # Paths that should be crawled and fetched. Glob based paths.  paths:    - /data/gitegg/log/*/*operation.log
    #- c:\programdata\elasticsearch\logs\*
  # Exclude lines. A list of regular expressions to match. It drops the lines that are
  # matching any regular expression from the list.
  #exclude_lines: ['^DBG']
  # Include lines. A list of regular expressions to match. It exports the lines that are
  # matching any regular expression from the list.
  #include_lines: ['^ERR', '^WARN']
  # Exclude files. A list of regular expressions to match. Filebeat drops the files that
  # are matching any regular expression from the list. By default, no files are dropped.
  #prospector.scanner.exclude_files: ['.gz$']
  # Optional additional fields. These fields can be freely picked
  # to add additional information to the crawled log files for filtering
  fields:
    topic: operation_log
  #  level: debug
  #  review: 1# filestream is an input for collecting log messages from files.- type: filestream
  # Change to true to enable this input configuration.
  enabled: true
  # Paths that should be crawled and fetched. Glob based paths.
  paths:
    - /data/gitegg/log/*/*api.log
    #- c:\programdata\elasticsearch\logs\*
  # Exclude lines. A list of regular expressions to match. It drops the lines that are
  # matching any regular expression from the list.  #exclude_lines: ['^DBG']  # Include lines. A list of regular expressions to match. It exports the lines that are
  # matching any regular expression from the list.  #include_lines: ['^ERR', '^WARN']  # Exclude files. A list of regular expressions to match. Filebeat drops the files that
  # are matching any regular expression from the list. By default, no files are dropped.  #prospector.scanner.exclude_files: ['.gz$']  # Optional additional fields. These fields can be freely picked
  # to add additional information to the crawled log files for filtering
  fields:    topic: api_log
  #  level: debug
  #  review: 1# filestream is an input for collecting log messages from files.- type: filestream
  # Change to true to enable this input configuration.  enabled: true
  # Paths that should be crawled and fetched. Glob based paths.  paths:    - /data/gitegg/log/*/*debug.log
    #- c:\programdata\elasticsearch\logs\*
  # Exclude lines. A list of regular expressions to match. It drops the lines that are
  # matching any regular expression from the list.
  #exclude_lines: ['^DBG']
  # Include lines. A list of regular expressions to match. It exports the lines that are
  # matching any regular expression from the list.
  #include_lines: ['^ERR', '^WARN']
  # Exclude files. A list of regular expressions to match. Filebeat drops the files that
  # are matching any regular expression from the list. By default, no files are dropped.
  #prospector.scanner.exclude_files: ['.gz$']
  # Optional additional fields. These fields can be freely picked
  # to add additional information to the crawled log files for filtering
  fields:
    topic: debugger_log
  #  level: debug
  #  review: 1# filestream is an input for collecting log messages from files.- type: filestream
  # Change to true to enable this input configuration.
  enabled: true
  # Paths that should be crawled and fetched. Glob based paths.
  paths:
    - /usr/local/nginx/logs/access.log
    #- c:\programdata\elasticsearch\logs\*
  # Exclude lines. A list of regular expressions to match. It drops the lines that are
  # matching any regular expression from the list.
  #exclude_lines: ['^DBG']
  # Include lines. A list of regular expressions to match. It exports the lines that are
  # matching any regular expression from the list.
  #include_lines: ['^ERR', '^WARN']
  # Exclude files. A list of regular expressions to match. Filebeat drops the files that
  # are matching any regular expression from the list. By default, no files are dropped.
  #prospector.scanner.exclude_files: ['.gz$']
  # Optional additional fields. These fields can be freely picked
  # to add additional information to the crawled log files for filtering
  fields:
    topic: nginx_log
  #  level: debug
  #  review: 1# ============================== Filebeat modules ==============================filebeat.config.modules:
  # Glob pattern for configuration loading
  path: ${path.config}/modules.d/*.yml
  # Set to true to enable config reloading
  reload.enabled: false
  # Period on which files under path should be checked for changes
  #reload.period: 10s# ======================= Elasticsearch template setting =======================setup.template.settings:
  index.number_of_shards: 3
  index.number_of_replicas: 1
  #index.codec: best_compression
  #_source.enabled: false# 允许自动生成index模板setup.template.enabled: true# # 生成index模板时字段配置文件setup.template.fields: fields.yml# # 如果存在模块则覆盖setup.template.overwrite: true# # 生成index模板的名称setup.template.name: "gitegg_log" # # 生成index模板匹配的index格式 setup.template.pattern: "filebeat-*" #索引生命周期管理ilm功能默认开启,开启的情况下索引名称只能为filebeat-*, 通过setup.ilm.enabled: false进行关闭;setup.ilm.pattern: "{now/d}"setup.ilm.enabled: false# ================================== General ===================================# The name of the shipper that publishes the network data. It can be used to group# all the transactions sent by a single shipper in the web interface.#name:# The tags of the shipper are included in their own field with each# transaction published.#tags: ["service-X", "web-tier"]# Optional fields that you can specify to add additional information to the# output.#fields:#  env: staging # ================================= Dashboards =================================# These settings control loading the sample dashboards to the Kibana index. Loading# the dashboards is disabled by default and can be enabled either by setting the# options here or by using the `setup` command.setup.dashboards.enabled: true# The URL from where to download the dashboards archive. By default this URL# has a value which is computed based on the Beat name and version. For released# versions, this URL points to the dashboard archive on the artifacts.elastic.co# website.#setup.dashboards.url:# =================================== Kibana ===================================# Starting with Beats version 6.0.0, the dashboards are loaded via the Kibana API.# This requires a Kibana endpoint configuration.setup.kibana:
  # Kibana Host
  # Scheme and port can be left out and will be set to the default (http and 5601)
  # In case you specify and additional path, the scheme is required: http://localhost:5601/path
  # IPv6 addresses should always be defined as: https://[2001:db8::1]:5601
  host: "172.16.20.220:5601"
  # Optional protocol and basic auth credentials.
  #protocol: "https"
  username: "elastic"
  password: "123456"
  # Optional HTTP path
  #path: ""
  # Optional Kibana space ID.
  #space.id: ""
  # Custom HTTP headers to add to each request
  #headers:
  #  X-My-Header: Contents of the header
  # Use SSL settings for HTTPS.
  #ssl.enabled: true# =============================== Elastic Cloud ================================# These settings simplify using Filebeat with the Elastic Cloud (https://cloud.elastic.co/).# The cloud.id setting overwrites the `output.elasticsearch.hosts` and# `setup.kibana.host` options.# You can find the `cloud.id` in the Elastic Cloud web UI.#cloud.id:# The cloud.auth setting overwrites the `output.elasticsearch.username` and# `output.elasticsearch.password` settings. The format is `<user>:<pass>`.#cloud.auth:# ================================== Outputs ===================================# Configure what output to use when sending the data collected by the beat.# ---------------------------- Elasticsearch Output ----------------------------#output.elasticsearch:
  # Array of hosts to connect to.
  hosts: ["localhost:9200"]
  # Protocol - either `http` (default) or `https`.
  #protocol: "https"
  # Authentication credentials - either API key or username/password.
  #api_key: "id:api_key"
  #username: "elastic"
  #password: "changeme"# ------------------------------ Logstash Output -------------------------------#output.logstash:
  # The Logstash hosts
  #hosts: ["localhost:5044"]
  # Optional SSL. By default is off.
  # List of root certificates for HTTPS server verifications
  #ssl.certificate_authorities: ["/etc/pki/root/ca.pem"]
  # Certificate for SSL client authentication
  #ssl.certificate: "/etc/pki/client/cert.pem"
  # Client Certificate Key
  #ssl.key: "/etc/pki/client/cert.key"# -------------------------------- Kafka Output --------------------------------output.kafka:
  # Boolean flag to enable or disable the output module.
  enabled: true
  # The list of Kafka broker addresses from which to fetch the cluster metadata.
  # The cluster metadata contain the actual Kafka brokers events are published
  # to.
  hosts: ["172.16.20.220:9092","172.16.20.221:9092","172.16.20.222:9092"]
  # The Kafka topic used for produced events. The setting can be a format string
  # using any event field. To set the topic from document type use `%{[type]}`.
  topic: '%{[fields.topic]}'
  # The Kafka event key setting. Use format string to create a unique event key.
  # By default no event key will be generated.
  #key: ''
  # The Kafka event partitioning strategy. Default hashing strategy is `hash`
  # using the `output.kafka.key` setting or randomly distributes events if
  # `output.kafka.key` is not configured.
  partition.hash:
    # If enabled, events will only be published to partitions with reachable
    # leaders. Default is false.
    reachable_only: true
    # Configure alternative event field names used to compute the hash value.
    # If empty `output.kafka.key` setting will be used.
    # Default value is empty list.
    #hash: []
  # Authentication details. Password is required if username is set.
  #username: ''
  #password: ''
  # SASL authentication mechanism used. Can be one of PLAIN, SCRAM-SHA-256 or SCRAM-SHA-512.
  # Defaults to PLAIN when `username` and `password` are configured.
  #sasl.mechanism: ''
  # Kafka version Filebeat is assumed to run against. Defaults to the "1.0.0".
  #version: '1.0.0'
  # Configure JSON encoding
  #codec.json:
    # Pretty-print JSON event
    #pretty: false
    # Configure escaping HTML symbols in strings.
    #escape_html: false
  # Metadata update configuration. Metadata contains leader information
  # used to decide which broker to use when publishing.
  #metadata:
    # Max metadata request retry attempts when cluster is in middle of leader
    # election. Defaults to 3 retries.
    #retry.max: 3
    # Wait time between retries during leader elections. Default is 250ms.
    #retry.backoff: 250ms
    # Refresh metadata interval. Defaults to every 10 minutes.
    #refresh_frequency: 10m
    # Strategy for fetching the topics metadata from the broker. Default is false.
    #full: false
  # The number of concurrent load-balanced Kafka output workers.
  #worker: 1
  # The number of times to retry publishing an event after a publishing failure.
  # After the specified number of retries, events are typically dropped.
  # Some Beats, such as Filebeat, ignore the max_retries setting and retry until
  # all events are published.  Set max_retries to a value less than 0 to retry
  # until all events are published. The default is 3.
  #max_retries: 3
  # The number of seconds to wait before trying to republish to Kafka
  # after a network error. After waiting backoff.init seconds, the Beat
  # tries to republish. If the attempt fails, the backoff timer is increased
  # exponentially up to backoff.max. After a successful publish, the backoff
  # timer is reset. The default is 1s.
  #backoff.init: 1s
  # The maximum number of seconds to wait before attempting to republish to
  # Kafka after a network error. The default is 60s.
  #backoff.max: 60s
  # The maximum number of events to bulk in a single Kafka request. The default
  # is 2048.
  #bulk_max_size: 2048
  # Duration to wait before sending bulk Kafka request. 0 is no delay. The default
  # is 0.
  #bulk_flush_frequency: 0s
  # The number of seconds to wait for responses from the Kafka brokers before
  # timing out. The default is 30s.
  #timeout: 30s
  # The maximum duration a broker will wait for number of required ACKs. The
  # default is 10s.
  #broker_timeout: 10s
  # The number of messages buffered for each Kafka broker. The default is 256.
  #channel_buffer_size: 256
  # The keep-alive period for an active network connection. If 0s, keep-alives
  # are disabled. The default is 0 seconds.
  #keep_alive: 0
  # Sets the output compression codec. Must be one of none, snappy and gzip. The
  # default is gzip.
  compression: gzip
  # Set the compression level. Currently only gzip provides a compression level
  # between 0 and 9. The default value is chosen by the compression algorithm.
  #compression_level: 4
  # The maximum permitted size of JSON-encoded messages. Bigger messages will be
  # dropped. The default value is 1000000 (bytes). This value should be equal to
  # or less than the broker's message.max.bytes.
  max_message_bytes: 1000000
  # The ACK reliability level required from broker. 0=no response, 1=wait for
  # local commit, -1=wait for all replicas to commit. The default is 1.  Note:
  # If set to 0, no ACKs are returned by Kafka. Messages might be lost silently
  # on error.
  required_acks: 1
  # The configurable ClientID used for logging, debugging, and auditing
  # purposes.  The default is "beats".
  #client_id: beats
  # Use SSL settings for HTTPS.
  #ssl.enabled: true
  # Controls the verification of certificates. Valid values are:
  # * full, which verifies that the provided certificate is signed by a trusted
  # authority (CA) and also verifies that the server's hostname (or IP address)
  # matches the names identified within the certificate.
  # * strict, which verifies that the provided certificate is signed by a trusted
  # authority (CA) and also verifies that the server's hostname (or IP address)
  # matches the names identified within the certificate. If the Subject Alternative
  # Name is empty, it returns an error.
  # * certificate, which verifies that the provided certificate is signed by a
  # trusted authority (CA), but does not perform any hostname verification.
  #  * none, which performs no verification of the server's certificate. This
  # mode disables many of the security benefits of SSL/TLS and should only be used
  # after very careful consideration. It is primarily intended as a temporary
  # diagnostic mechanism when attempting to resolve TLS errors; its use in
  # production environments is strongly discouraged.
  # The default value is full.
  #ssl.verification_mode: full
  # List of supported/valid TLS versions. By default all TLS versions from 1.1
  # up to 1.3 are enabled.
  #ssl.supported_protocols: [TLSv1.1, TLSv1.2, TLSv1.3]
  # List of root certificates for HTTPS server verifications
  #ssl.certificate_authorities: ["/etc/pki/root/ca.pem"]
  # Certificate for SSL client authentication
  #ssl.certificate: "/etc/pki/client/cert.pem"
  # Client certificate key
  #ssl.key: "/etc/pki/client/cert.key"
  # Optional passphrase for decrypting the certificate key.
  #ssl.key_passphrase: ''
  # Configure cipher suites to be used for SSL connections
  #ssl.cipher_suites: []
  # Configure curve types for ECDHE-based cipher suites
  #ssl.curve_types: []
  # Configure what types of renegotiation are supported. Valid options are
  # never, once, and freely. Default is never.
  #ssl.renegotiation: never
  # Configure a pin that can be used to do extra validation of the verified certificate chain,
  # this allow you to ensure that a specific certificate is used to validate the chain of trust.
  #
  # The pin is a base64 encoded string of the SHA-256 fingerprint.
  #ssl.ca_sha256: ""
  # A root CA HEX encoded fingerprint. During the SSL handshake if the
  # fingerprint matches the root CA certificate, it will be added to
  # the provided list of root CAs (`certificate_authorities`), if the
  # list is empty or not defined, the matching certificate will be the
  # only one in the list. Then the normal SSL validation happens.
  #ssl.ca_trusted_fingerprint: ""
  # Enable Kerberos support. Kerberos is automatically enabled if any Kerberos setting is set.
  #kerberos.enabled: true
  # Authentication type to use with Kerberos. Available options: keytab, password.
  #kerberos.auth_type: password
  # Path to the keytab file. It is used when auth_type is set to keytab.
  #kerberos.keytab: /etc/security/keytabs/kafka.keytab
  # Path to the Kerberos configuration.
  #kerberos.config_path: /etc/krb5.conf
  # The service name. Service principal name is contructed from
  # service_name/hostname@realm.
  #kerberos.service_name: kafka
  # Name of the Kerberos user.
  #kerberos.username: elastic
  # Password of the Kerberos user. It is used when auth_type is set to password.
  #kerberos.password: changeme
  # Kerberos realm.
  #kerberos.realm: ELASTIC
  # Enables Kerberos FAST authentication. This may
  # conflict with certain Active Directory configurations.
  #kerberos.enable_krb5_fast: false# ================================= Processors =================================processors:
  - add_host_metadata:
      when.not.contains.tags: forwarded
  - add_cloud_metadata: ~
  - add_docker_metadata: ~
  - add_kubernetes_metadata: ~# ================================== Logging ===================================# Sets log level. The default log level is info.# Available log levels are: error, warning, info, debug#logging.level: debug# At debug level, you can selectively enable logging only for some components.# To enable all selectors use ["*"]. Examples of other selectors are "beat",# "publisher", "service".#logging.selectors: ["*"]# ============================= X-Pack Monitoring ==============================# Filebeat can export internal metrics to a central Elasticsearch monitoring# cluster.  This requires xpack monitoring to be enabled in Elasticsearch.  The# reporting is disabled by default.# Set to true to enable the monitoring reporter.#monitoring.enabled: false# Sets the UUID of the Elasticsearch cluster under which monitoring data for this# Filebeat instance will appear in the Stack Monitoring UI. If output.elasticsearch# is enabled, the UUID is derived from the Elasticsearch cluster referenced by output.elasticsearch.#monitoring.cluster_uuid:# Uncomment to send the metrics to Elasticsearch. Most settings from the# Elasticsearch output are accepted here as well.# Note that the settings should point to your Elasticsearch *monitoring* cluster.# Any setting that is not set is automatically inherited from the Elasticsearch# output configuration, so if you have the Elasticsearch output configured such# that it is pointing to your Elasticsearch monitoring cluster, you can simply# uncomment the following line.#monitoring.elasticsearch:# ============================== Instrumentation ===============================# Instrumentation support for the filebeat.#instrumentation:
    # Set to true to enable instrumentation of filebeat.
    #enabled: false
    # Environment in which filebeat is running on (eg: staging, production, etc.)
    #environment: ""
    # APM Server hosts to report instrumentation results to.
    #hosts:
    #  - http://localhost:8200
    # API Key for the APM Server(s).
    # If api_key is set then secret_token will be ignored.
    #api_key:
    # Secret token for the APM Server(s).
    #secret_token:# ================================= Migration ==================================# This allows to enable 6.7 migration aliases#migration.6_to_7.enabled: true1.2.3.4.5.6.7.8.9.10.11.12.13.14.15.16.17.18.19.20.21.22.23.24.25.26.27.28.29.30.31.32.33.34.35.36.37.38.39.40.41.42.43.44.45.46.47.48.49.50.51.52.53.54.55.56.57.58.59.60.61.62.63.64.65.66.67.68.69.70.71.72.73.74.75.76.77.78.79.80.81.82.83.84.85.86.87.88.89.90.91.92.93.94.95.96.97.98.99.100.101.102.103.104.105.106.107.108.109.110.111.112.113.114.115.116.117.118.119.120.121.122.123.124.125.126.127.128.129.130.131.132.133.134.135.136.137.138.139.140.141.142.143.144.145.146.147.148.149.150.151.152.153.154.155.156.157.158.159.160.161.162.163.164.165.166.167.168.169.170.171.172.173.174.175.176.177.178.179.180.181.182.183.184.185.186.187.188.189.190.191.192.193.194.195.196.197.198.199.200.201.202.203.204.205.206.207.208.209.210.211.212.213.214.215.216.217.218.219.220.221.222.223.224.225.226.227.228.229.230.231.232.233.234.235.236.237.238.239.240.241.242.243.244.245.246.247.248.249.250.251.252.253.254.255.256.257.258.259.260.261.262.263.264.265.266.267.268.269.270.271.272.273.274.275.276.277.278.279.280.281.282.283.284.285.286.287.288.289.290.291.292.293.294.295.296.297.298.299.300.301.302.303.304.305.306.307.308.309.310.311.312.313.314.315.316.317.318.319.320.321.322.323.324.325.326.327.328.329.330.331.332.333.334.335.336.337.338.339.340.341.342.343.344.345.346.347.348.349.350.351.352.353.354.355.356.357.358.359.360.361.362.363.364.365.366.367.368.369.370.371.372.373.374.375.376.377.378.379.380.381.382.383.384.385.386.387.388.389.390.391.392.393.394.395.396.397.398.399.400.401.402.403.404.405.406.407.408.409.410.411.412.413.414.415.416.417.418.419.420.421.422.423.424.425.426.427.428.429.430.431.
执行filebeat启动命令:
复制
./filebeat -e -c filebeat.yml1.
后台启动命令:
复制
nohup ./filebeat -e -c filebeat.yml >/dev/null 2>&1 &1.
停止命令:
复制
ps -ef |grep filebeatkill -9 进程号1.2.
六、测试配置是否正确
1、测试filebeat是否能够采集log文件并发送到Kafka
在kafka服务器开启消费者,监听api_log主题和operation_log主题。
复制
./kafka-console-consumer.sh --bootstrap-server 172.16.20.221:9092 --topic api_log./kafka-console-consumer.sh --bootstrap-server 172.16.20.222:9092 --topic operation_log1.2.
手动写入日志文件,按照filebeat配置的采集目录写入。
复制
echo "api log1111" > /data/gitegg/log/gitegg-service-system/api.logecho "operation log1111" > /data/gitegg/log/gitegg-service-system/operation.log1.2.
观察消费者是消费到日志推送内容。

2、测试logstash是消费Kafka的日志主题,并将日志内容存入Elasticsearch
手动写入日志文件:
复制
echo "api log8888888888888888888888" > /data/gitegg/log/gitegg-service-system/api.logecho "operation loggggggggggggggggggg" > /data/gitegg/log/gitegg-service-system/operation.log1.2.
打开Elasticsearch Head界面 http://172.16.20.220:9100/?auth_user=elastic&auth_password=123456 ,查询Elasticsearch是否有数据。
自动新增的两个index,规则是logstash中配置的。
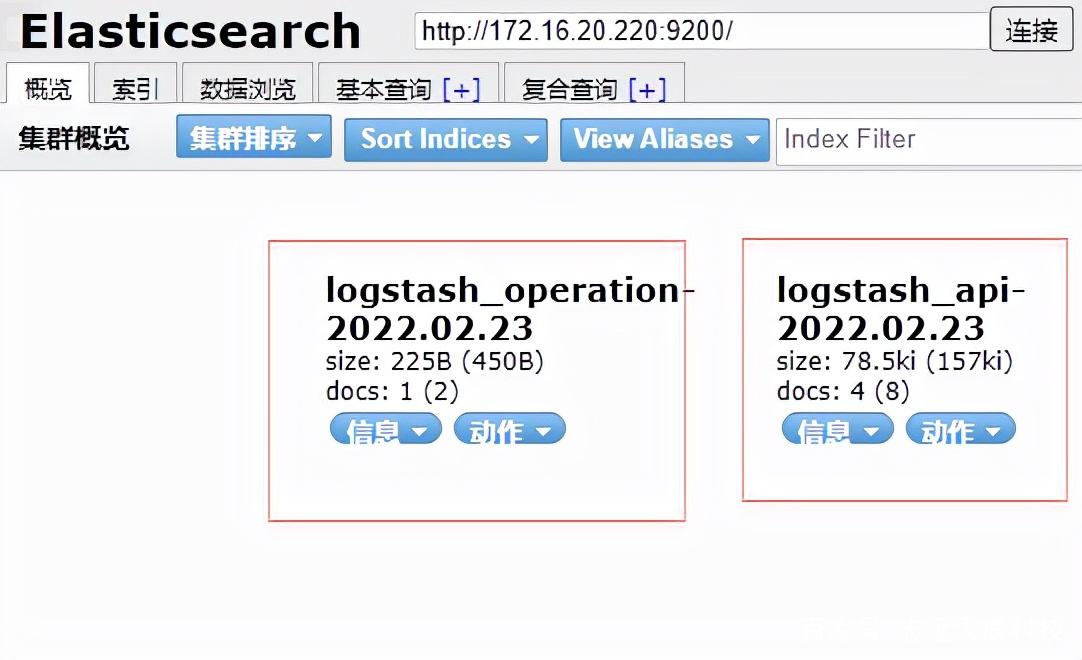 编辑搜图
编辑搜图
数据浏览页可以看到Elasticsearch中存储的日志数据内容,说明我们的配置已经生效。
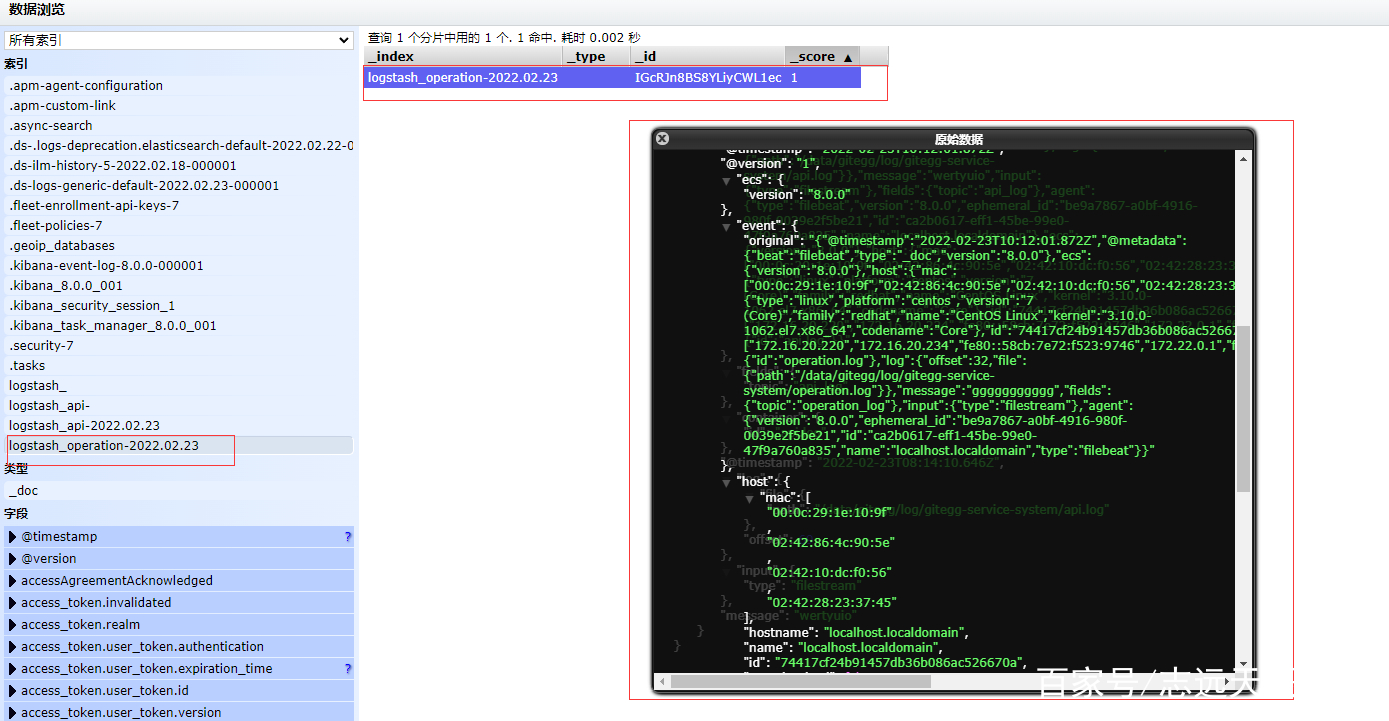 编辑搜图
编辑搜图
七、配置Kibana用于日志统计和展示
依次点击左侧菜单Management -> Kibana -> Data Views -> Create data view , 输入logstash_* ,选择@timestamp,再点击Create data view按钮,完成创建。
本公司销售:阿里云、腾讯云、百度云、天翼云、金山大米云、金山企业云盘!可签订合同,开具发票。
可优惠产品清单

一次合作 终生朋友

部分客户(无排名)


我有话说: